
Where in Britain are the best roofs for solar?
We checked the roof of every house in England, Wales and Scotland from the air, 16,008,344 homes in all, and graded each one for solar. Look up your area, see how it ranks and find out where solar panels make the most sense.
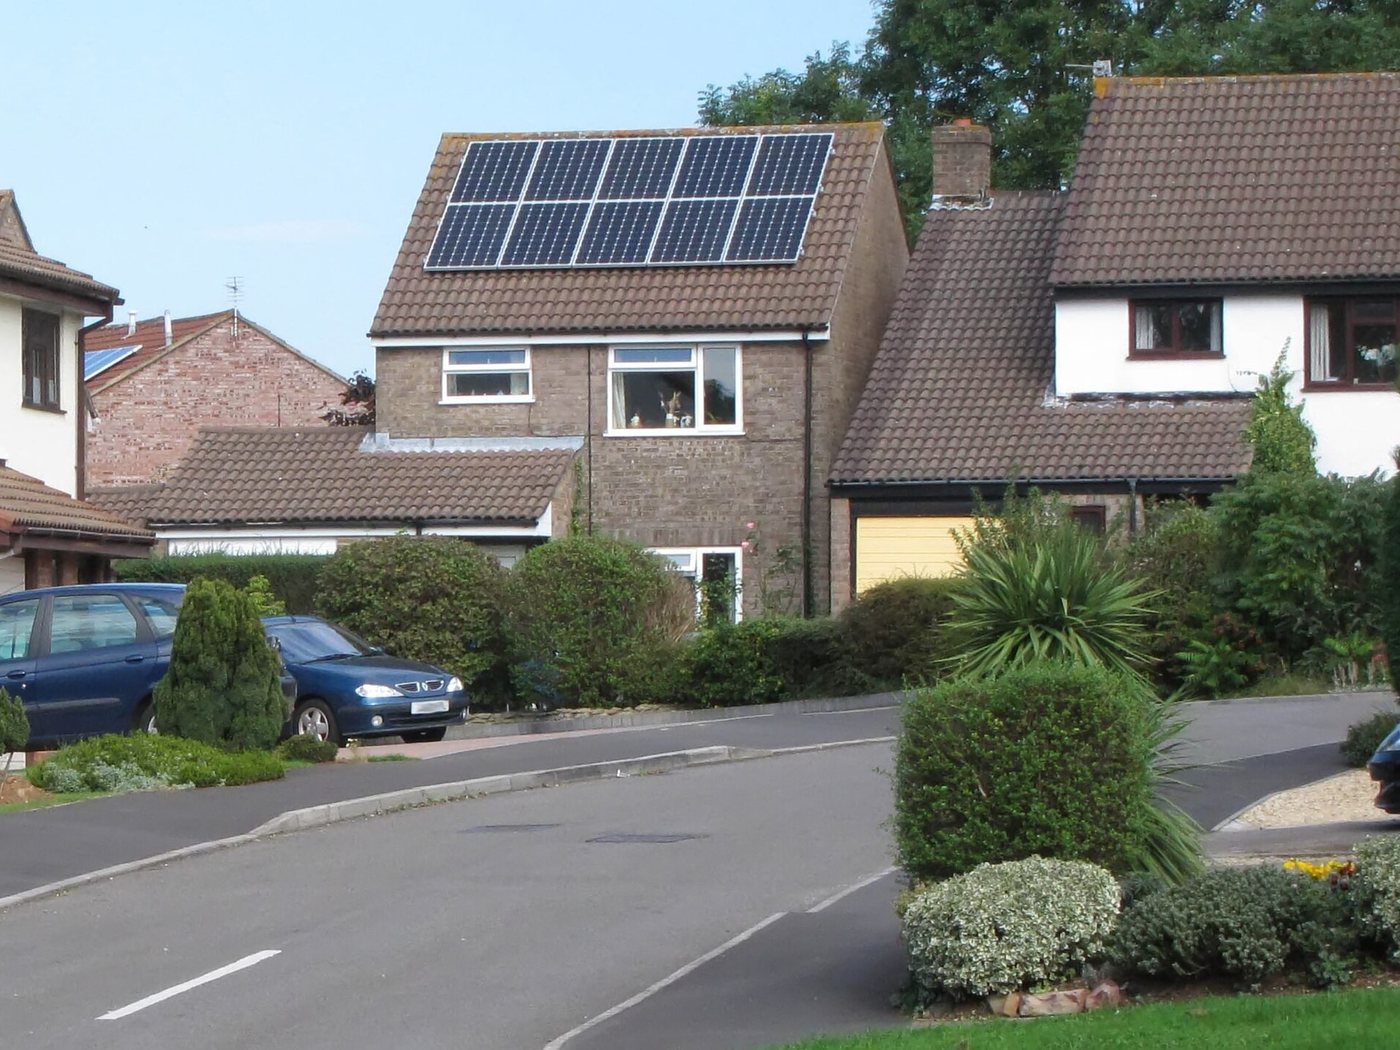

What is the UK Solar Roof Index?
Most solar maps tell you how sunny a place is. In Britain, the sun matters less than the roof: which way it faces and how big it is. So we measured the roofs.
- 17,830,853buildings measured from the air
We looked at every roof
Survey planes have laser-scanned almost all of Britain. From that we worked out which way every roof slope faces and how much space it has.
- A+ABC16,008,344 homes graded
We graded each one
Every house with room for at least six panels got a grade, from A+ (a big roof facing due south) down to C. Flats, shops and homes that already have panels were left out.
- 328 areas + 50 townsranked, mapped and free to share
You can explore it free
See how your council area and the top 50 towns compare, with sunshine figures for each. All of it is free to use, quote and download.
Who it is for
What we found
- 10.3%
Just 10.3% of British homes (1,652,335) have a top-rated A or A+ roof for solar, and 1.2% have an A+ roof facing due south.
- 19.6%
Stratford-on-Avon has the highest share of top-rated roofs of any council area: 19.6%, 1.9 times the national average.
- 27.7%
Bexhill-on-Sea is the most solar-ready large town in Britain, with 27.7% of homes rated A or A+.
- 25,761
Cornwall has the most top-rated roofs of any council area: 25,761 A and A+ homes.
- 1,176 kWh
Chichester is the sunniest council area for solar, at about 1,176 kWh a year per kW of south-facing panels, against 810 kWh in Inverclyde.
- 13.5
The average graded British roof fits 13.5 panels. Orkney Islands has the biggest roofs, at 16.5 panels on the average graded home.
- 11.6 TWh
If every A and A+ roof in Britain had panels, they could generate roughly 11.6 TWh a year (estimate: 11,598 MW of panels at the average British yield).
- 97/100
Rother and Lewes share the highest Solar Marketing Score (97/100), combining top-rated roofs, sunshine and owner-occupiers.
The solar roof map of Britain
Every square is shaded by its own homes. Switch between the best roofs and how big the roofs are.
Each square is about 5 km across. Hover or tap a square to see its numbers, and click to open that area's page.
Parts of northern and rural Scotland have gaps in the laser survey, so their roofs are capped at B and look paler than they are. Those council areas are left out of the tables below.
What do the grades mean?
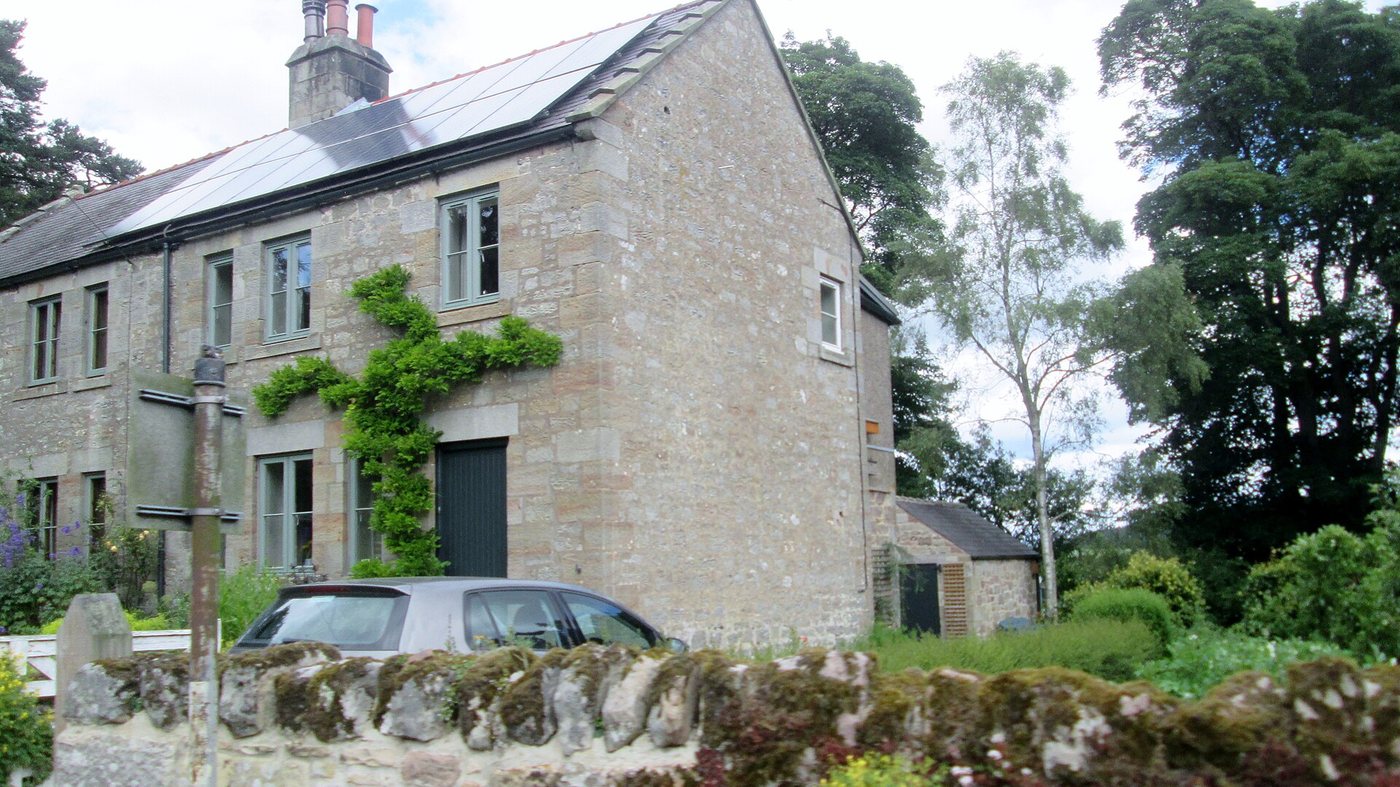

A roof facing due south catches the most sun across the day, so it produces the most power. East and west roofs still work, especially with a battery, which is why many B and C homes are good candidates too. How the grades are worked out.
Council area league tables
"Top-rated roofs" is the share of homes graded A or A+. The marketing score (out of 100) blends top-rated roofs, sunshine, owner-occupiers and how many homes are still without panels.
| # | Council area | Top-rated roofs | Top-rated homes | Sunshine (kWh per kW) | Panels per roof | Marketing score |
|---|---|---|---|---|---|---|
| 1 | Stratford-on-Avon West Midlands | 19.6% | 8,620 | 1,009 | 14.8 | 79 |
| 2 | Epsom and Ewell South East | 19.4% | 4,449 | 1,017 | 14.4 | 83 |
| 3 | Isle of Wight South East | 19.3% | 8,658 | 1,166 | 14.3 | 96 |
| 4 | Rother South East | 19.2% | 6,039 | 1,121 | 15.3 | 97 |
| 5 | East Hampshire South East | 18.9% | 6,977 | 1,045 | 15.3 | 94 |
| 6 | City of Edinburgh Scotland | 18.0% | 10,862 | 883 | 13.7 | 67 |
| 7 | New Forest South East | 17.9% | 11,158 | 1,127 | 15.0 | 93 |
| 8 | Lewes South East | 17.8% | 5,434 | 1,166 | 14.6 | 97 |
| 9 | North Somerset South West | 17.5% | 11,770 | 1,016 | 14.0 | 77 |
| 10 | Dorset South West | 17.3% | 22,015 | 1,110 | 14.9 | 92 |
| 11 | Scottish Borders Scotland | 17.1% | 5,314 | 914 | 15.8 | 68 |
| 12 | Arun South East | 16.9% | 8,554 | 1,150 | 14.7 | 95 |
| 13 | Rugby West Midlands | 16.6% | 5,492 | 1,000 | 13.9 | 70 |
| 14 | Northumberland North East | 16.4% | 18,265 | 953 | 13.4 | 71 |
| 15 | Test Valley South East | 16.4% | 6,900 | 1,040 | 14.1 | 85 |
| 16 | Solihull West Midlands | 15.9% | 10,030 | 980 | 13.5 | 78 |
| 17 | Warwick West Midlands | 15.8% | 6,556 | 997 | 13.6 | 67 |
| 18 | Mid Devon South West | 15.8% | 4,525 | 1,022 | 15.0 | 68 |
| 19 | Horsham South East | 15.8% | 7,458 | 1,086 | 14.7 | 92 |
| 20 | Mid Sussex South East | 15.6% | 7,381 | 1,085 | 13.9 | 94 |
| 21 | South Norfolk East of England | 15.4% | 7,452 | 1,040 | 15.1 | 81 |
| 22 | West Lothian Scotland | 15.2% | 6,960 | 827 | 13.7 | 62 |
| 23 | Winchester South East | 15.2% | 5,559 | 1,054 | 14.7 | 82 |
| 24 | Waverley South East | 15.1% | 5,665 | 1,034 | 15.0 | 88 |
| 25 | Broadland East of England | 15.1% | 7,344 | 1,030 | 14.3 | 84 |
| 26 | Worthing South East | 14.9% | 3,973 | 1,143 | 13.9 | 95 |
| 27 | Mole Valley South East | 14.9% | 3,789 | 1,028 | 15.9 | 87 |
| 28 | Malvern Hills West Midlands | 14.8% | 4,047 | 1,004 | 14.8 | 78 |
| 29 | South Hams South West | 14.8% | 4,634 | 1,098 | 15.1 | 82 |
| 30 | Midlothian Scotland | 14.6% | 3,210 | 896 | 13.7 | 62 |
| 31 | East Devon South West | 14.6% | 7,393 | 1,053 | 14.8 | 85 |
| 32 | Fareham South East | 14.6% | 5,202 | 1,102 | 14.4 | 90 |
| 33 | Dundee City Scotland | 14.5% | 4,401 | 936 | 12.8 | 65 |
| 34 | Cornwall South West | 14.5% | 25,761 | 1,064 | 15.6 | 73 |
| 35 | Bath and North East Somerset South West | 14.5% | 7,371 | 1,021 | 13.8 | 65 |
| 36 | Bromsgrove West Midlands | 14.4% | 4,582 | 969 | 14.1 | 76 |
| 37 | Wiltshire South West | 14.4% | 22,131 | 1,038 | 14.2 | 74 |
| 38 | Tendring East of England | 14.4% | 7,912 | 1,107 | 13.2 | 84 |
| 39 | Folkestone and Hythe South East | 14.4% | 4,696 | 1,115 | 13.8 | 86 |
| 40 | Wealden South East | 14.3% | 7,954 | 1,145 | 14.7 | 93 |
| 41 | Cheshire East North West | 14.2% | 17,418 | 923 | 14.0 | 66 |
| 42 | Crawley South East | 14.2% | 4,093 | 1,035 | 12.9 | 70 |
| 43 | Lichfield West Midlands | 14.1% | 4,850 | 973 | 13.0 | 74 |
| 44 | South Cambridgeshire East of England | 14.1% | 7,791 | 1,043 | 13.5 | 75 |
| 45 | Tunbridge Wells South East | 14.1% | 4,109 | 1,065 | 14.4 | 85 |
| 46 | Newark and Sherwood East Midlands | 14.0% | 5,128 | 998 | 14.4 | 68 |
| 47 | Nuneaton and Bedworth West Midlands | 14.0% | 5,704 | 984 | 12.5 | 66 |
| 48 | Torridge South West | 14.0% | 3,149 | 1,015 | 15.4 | 70 |
| 49 | Woking South East | 14.0% | 3,544 | 1,024 | 13.9 | 73 |
| 50 | Fife Scotland | 13.9% | 12,585 | 929 | 14.1 | 61 |
| 51 | Canterbury South East | 13.8% | 5,994 | 1,099 | 14.1 | 72 |
| 52 | Ribble Valley North West | 13.7% | 2,611 | 876 | 15.2 | 64 |
| 53 | South Oxfordshire South East | 13.7% | 6,461 | 1,007 | 14.2 | 69 |
| 54 | West Devon South West | 13.7% | 2,506 | 948 | 15.9 | 55 |
| 55 | Chichester South East | 13.7% | 5,115 | 1,176 | 15.3 | 79 |
| 56 | Elmbridge South East | 13.7% | 5,033 | 1,024 | 15.0 | 74 |
| 57 | Adur South East | 13.7% | 2,413 | 1,145 | 13.9 | 91 |
| 58 | Blaby East Midlands | 13.6% | 4,334 | 990 | 13.7 | 71 |
| 59 | Stroud South West | 13.5% | 5,118 | 1,001 | 14.2 | 70 |
| 60 | Somerset South West | 13.4% | 24,376 | 1,038 | 14.4 | 71 |
| 61 | Reigate and Banstead South East | 13.4% | 5,031 | 1,019 | 14.1 | 78 |
| 62 | West Lancashire North West | 13.3% | 4,575 | 948 | 14.4 | 69 |
| 63 | Oadby and Wigston East Midlands | 13.2% | 2,362 | 1,004 | 13.4 | 67 |
| 64 | Havant South East | 13.2% | 4,495 | 1,133 | 14.2 | 85 |
| 65 | Guildford South East | 13.2% | 5,100 | 1,020 | 14.5 | 67 |
| 66 | St Albans East of England | 13.2% | 5,103 | 1,023 | 14.3 | 75 |
| 67 | North Warwickshire West Midlands | 13.1% | 2,612 | 975 | 13.3 | 66 |
| 68 | North West Leicestershire East Midlands | 13.1% | 4,150 | 979 | 14.0 | 66 |
| 69 | Wychavon West Midlands | 13.1% | 5,672 | 1,004 | 14.2 | 64 |
| 70 | South Gloucestershire South West | 13.1% | 12,601 | 1,003 | 12.5 | 58 |
| 71 | North Tyneside North East | 13.0% | 6,168 | 966 | 12.3 | 71 |
| 72 | Hastings South East | 13.0% | 2,782 | 1,129 | 13.7 | 70 |
| 73 | North Devon South West | 12.9% | 3,880 | 1,007 | 15.4 | 60 |
| 74 | Bournemouth, Christchurch and Poole South West | 12.9% | 11,541 | 1,105 | 13.5 | 79 |
| 75 | West Berkshire South East | 12.8% | 5,834 | 1,027 | 13.9 | 67 |
| 76 | Chorley North West | 12.7% | 4,777 | 896 | 12.2 | 57 |
| 77 | South Staffordshire West Midlands | 12.7% | 4,167 | 954 | 14.2 | 67 |
| 78 | Milton Keynes South East | 12.7% | 7,926 | 1,005 | 13.4 | 54 |
| 79 | Teignbridge South West | 12.7% | 5,336 | 1,063 | 14.4 | 76 |
| 80 | York Yorkshire and The Humber | 12.6% | 6,515 | 961 | 13.0 | 48 |
| 81 | Welwyn Hatfield East of England | 12.6% | 3,300 | 1,026 | 13.7 | 59 |
| 82 | Westmorland and Furness North West | 12.5% | 8,772 | 899 | 14.7 | 56 |
| 83 | Harborough East Midlands | 12.5% | 4,000 | 1,011 | 14.7 | 68 |
| 84 | Redditch West Midlands | 12.5% | 2,620 | 996 | 12.8 | 64 |
| 85 | Eastleigh South East | 12.5% | 5,080 | 1,085 | 12.9 | 81 |
| 86 | Uttlesford East of England | 12.5% | 3,176 | 1,043 | 15.0 | 78 |
| 87 | Hart South East | 12.4% | 3,550 | 1,030 | 14.9 | 78 |
| 88 | Ashford South East | 12.4% | 4,938 | 1,113 | 13.0 | 72 |
| 89 | North Lanarkshire Scotland | 12.3% | 7,865 | 838 | 13.8 | 49 |
| 90 | High Peak East Midlands | 12.2% | 2,556 | 869 | 14.3 | 62 |
| 91 | Shropshire West Midlands | 12.2% | 12,424 | 969 | 14.5 | 57 |
| 92 | Swindon South West | 12.2% | 8,858 | 1,018 | 12.6 | 60 |
| 93 | Basingstoke and Deane South East | 12.2% | 6,018 | 1,025 | 14.0 | 65 |
| 94 | Sevenoaks South East | 12.2% | 4,350 | 1,033 | 14.8 | 76 |
| 95 | East Staffordshire West Midlands | 12.1% | 3,951 | 971 | 13.8 | 56 |
| 96 | Newcastle upon Tyne North East | 12.0% | 6,765 | 946 | 12.2 | 46 |
| 97 | Rutland East Midlands | 12.0% | 1,336 | 1,016 | 15.6 | 65 |
| 98 | North Kesteven East Midlands | 12.0% | 4,677 | 1,020 | 15.2 | 61 |
| 99 | Wyre Forest West Midlands | 12.0% | 3,278 | 982 | 13.8 | 60 |
| 100 | Tewkesbury South West | 12.0% | 3,975 | 990 | 13.5 | 57 |
| 101 | Buckinghamshire South East | 12.0% | 17,172 | 1,000 | 14.8 | 66 |
| 102 | Central Bedfordshire East of England | 12.0% | 10,027 | 1,018 | 13.5 | 65 |
| 103 | Brighton and Hove South East | 12.0% | 6,483 | 1,157 | 13.4 | 65 |
| 104 | Vale of Glamorgan Wales | 11.9% | 5,206 | 1,064 | 13.9 | 63 |
| 105 | Tandridge South East | 11.9% | 3,017 | 1,031 | 15.5 | 77 |
| 106 | North Yorkshire Yorkshire and The Humber | 11.8% | 22,386 | 957 | 14.6 | 56 |
| 107 | Cambridge East of England | 11.7% | 2,640 | 1,037 | 11.7 | 54 |
| 108 | Hammersmith and Fulham London | 11.6% | 1,353 | 1,034 | 14.0 | 54 |
| 109 | Melton East Midlands | 11.5% | 1,944 | 1,001 | 15.0 | 58 |
| 110 | Breckland East of England | 11.4% | 5,674 | 1,026 | 14.7 | 57 |
| 111 | Babergh East of England | 11.3% | 3,585 | 1,068 | 14.6 | 72 |
| 112 | Haringey London | 11.3% | 3,237 | 1,024 | 13.4 | 49 |
| 113 | Basildon East of England | 11.3% | 5,011 | 1,068 | 14.5 | 74 |
| 114 | Castle Point East of England | 11.3% | 3,268 | 1,079 | 15.3 | 76 |
| 115 | Redcar and Cleveland North East | 11.2% | 4,668 | 945 | 13.7 | 48 |
| 116 | South Kesteven East Midlands | 11.2% | 4,593 | 1,026 | 14.8 | 60 |
| 117 | Vale of White Horse South East | 11.2% | 4,719 | 1,034 | 14.0 | 68 |
| 118 | Chelmsford East of England | 11.2% | 5,272 | 1,060 | 14.5 | 76 |
| 119 | Stafford West Midlands | 11.1% | 4,376 | 952 | 13.8 | 55 |
| 120 | Forest of Dean South West | 11.1% | 3,376 | 997 | 14.5 | 64 |
| 121 | West Oxfordshire South East | 11.1% | 3,678 | 1,017 | 14.8 | 54 |
| 122 | Runnymede South East | 11.1% | 2,614 | 1,025 | 13.5 | 59 |
| 123 | North Norfolk East of England | 11.1% | 4,222 | 1,041 | 15.1 | 70 |
| 124 | Inverclyde Scotland | 11.0% | 1,295 | 810 | 14.4 | 40 |
| 125 | West Lindsey East Midlands | 11.0% | 3,709 | 1,003 | 15.1 | 48 |
| 126 | Warrington North West | 11.0% | 6,571 | 936 | 12.5 | 52 |
| 127 | Rushcliffe East Midlands | 11.0% | 4,126 | 984 | 14.0 | 59 |
| 128 | Surrey Heath South East | 11.0% | 2,910 | 1,023 | 14.6 | 67 |
| 129 | East Suffolk East of England | 11.0% | 6,725 | 1,102 | 15.1 | 67 |
| 130 | Westminster London | 11.0% | 591 | 1,026 | 14.0 | 47 |
| 131 | South Ribble North West | 10.9% | 4,174 | 909 | 12.4 | 53 |
| 132 | Staffordshire Moorlands West Midlands | 10.9% | 3,610 | 916 | 14.0 | 55 |
| 133 | Bedford East of England | 10.9% | 5,281 | 1,028 | 13.8 | 55 |
| 134 | Leicester East Midlands | 10.8% | 5,861 | 994 | 13.1 | 42 |
| 135 | Gedling East Midlands | 10.8% | 3,998 | 980 | 12.7 | 52 |
| 136 | Herefordshire West Midlands | 10.8% | 6,707 | 993 | 14.5 | 48 |
| 137 | Torbay South West | 10.8% | 3,634 | 1,080 | 13.5 | 66 |
| 138 | Norwich East of England | 10.8% | 2,950 | 1,032 | 11.6 | 48 |
| 139 | Maldon East of England | 10.8% | 2,399 | 1,085 | 14.2 | 76 |
| 140 | South Derbyshire East Midlands | 10.7% | 3,922 | 965 | 13.2 | 45 |
| 141 | North East Derbyshire East Midlands | 10.7% | 3,174 | 959 | 13.6 | 59 |
| 142 | Mansfield East Midlands | 10.7% | 3,073 | 965 | 13.1 | 43 |
| 143 | West Suffolk East of England | 10.7% | 5,559 | 1,035 | 14.3 | 49 |
| 144 | Cotswold South West | 10.6% | 3,271 | 1,018 | 14.8 | 47 |
| 145 | Wigan North West | 10.5% | 8,398 | 930 | 12.5 | 43 |
| 146 | Cannock Chase West Midlands | 10.5% | 2,900 | 954 | 13.1 | 53 |
| 147 | Bassetlaw East Midlands | 10.5% | 4,357 | 979 | 13.1 | 45 |
| 148 | Bracknell Forest South East | 10.5% | 3,269 | 1,015 | 13.8 | 58 |
| 149 | East Hertfordshire East of England | 10.5% | 4,755 | 1,026 | 13.5 | 63 |
| 150 | Orkney Islands Scotland | 10.4% | 1,398 | 819 | 16.5 | 36 |
| 151 | Hertsmere East of England | 10.4% | 2,970 | 1,015 | 13.6 | 53 |
| 152 | Bromley London | 10.4% | 8,559 | 1,023 | 14.0 | 65 |
| 153 | Bexley London | 10.4% | 5,987 | 1,042 | 13.5 | 67 |
| 154 | Tonbridge and Malling South East | 10.4% | 3,676 | 1,061 | 14.1 | 70 |
| 155 | Blackburn with Darwen North West | 10.3% | 3,136 | 874 | 12.7 | 34 |
| 156 | Stockton-on-Tees North East | 10.2% | 5,646 | 945 | 13.6 | 42 |
| 157 | Bolton North West | 10.2% | 8,795 | 902 | 11.0 | 33 |
| 158 | Plymouth South West | 10.2% | 5,418 | 1,097 | 12.4 | 55 |
| 159 | Camden London | 10.2% | 772 | 1,027 | 14.3 | 45 |
| 160 | Dudley West Midlands | 10.1% | 7,841 | 946 | 12.9 | 51 |
| 161 | Southampton South East | 10.1% | 5,198 | 1,079 | 12.1 | 50 |
| 162 | Windsor and Maidenhead South East | 10.1% | 3,871 | 1,018 | 14.1 | 51 |
| 163 | Three Rivers East of England | 10.1% | 2,609 | 1,013 | 14.3 | 59 |
| 164 | Eastbourne South East | 10.1% | 2,159 | 1,160 | 14.2 | 58 |
| 165 | Braintree East of England | 10.0% | 4,148 | 1,065 | 14.4 | 66 |
| 166 | Wyre North West | 9.9% | 3,526 | 1,010 | 14.3 | 55 |
| 167 | Hinckley and Bosworth East Midlands | 9.9% | 3,566 | 987 | 13.1 | 52 |
| 168 | Charnwood East Midlands | 9.9% | 5,034 | 858 | 13.3 | 32 |
| 169 | Brentwood East of England | 9.9% | 2,106 | 1,049 | 15.1 | 68 |
| 170 | Mid Suffolk East of England | 9.9% | 3,928 | 1,053 | 14.7 | 63 |
| 171 | North Ayrshire Scotland | 9.8% | 3,944 | 899 | 13.7 | 33 |
| 172 | County Durham North East | 9.8% | 14,897 | 940 | 12.8 | 33 |
| 173 | Fylde North West | 9.8% | 2,390 | 1,004 | 14.9 | 59 |
| 174 | Cheshire West and Chester North West | 9.8% | 11,510 | 945 | 12.4 | 41 |
| 175 | Cherwell South East | 9.8% | 4,716 | 1,017 | 13.4 | 41 |
| 176 | Colchester East of England | 9.8% | 4,820 | 1,081 | 13.8 | 54 |
| 177 | Rochford East of England | 9.8% | 2,842 | 1,077 | 15.0 | 69 |
| 178 | Isle of Anglesey Wales | 9.7% | 2,726 | 1,007 | 15.3 | 40 |
| 179 | Huntingdonshire East of England | 9.7% | 5,613 | 1,039 | 12.9 | 51 |
| 180 | South Holland East Midlands | 9.7% | 3,387 | 1,038 | 14.9 | 53 |
| 181 | Kirklees Yorkshire and The Humber | 9.6% | 10,767 | 931 | 12.5 | 40 |
| 182 | Wokingham South East | 9.6% | 4,958 | 1,017 | 13.6 | 53 |
| 183 | Derbyshire Dales East Midlands | 9.5% | 2,404 | 915 | 14.1 | 45 |
| 184 | Spelthorne South East | 9.5% | 2,267 | 1,024 | 13.5 | 58 |
| 185 | Cheltenham South West | 9.4% | 3,073 | 991 | 11.6 | 38 |
| 186 | Dacorum East of England | 9.4% | 3,110 | 1,013 | 14.3 | 56 |
| 187 | Maidstone South East | 9.4% | 4,285 | 1,075 | 14.3 | 61 |
| 188 | Amber Valley East Midlands | 9.3% | 3,354 | 972 | 13.4 | 47 |
| 189 | East Cambridgeshire East of England | 9.3% | 2,917 | 1,035 | 13.8 | 48 |
| 190 | Sutton London | 9.3% | 3,760 | 1,015 | 13.9 | 57 |
| 191 | Oldham North West | 9.2% | 4,468 | 864 | 12.4 | 31 |
| 192 | Ashfield East Midlands | 9.2% | 3,365 | 965 | 12.5 | 36 |
| 193 | Telford and Wrekin West Midlands | 9.1% | 4,444 | 962 | 13.3 | 30 |
| 194 | West Northamptonshire East Midlands | 9.1% | 10,280 | 1,020 | 13.8 | 40 |
| 195 | South Tyneside North East | 9.0% | 2,716 | 983 | 12.0 | 51 |
| 196 | Wolverhampton West Midlands | 9.0% | 4,635 | 950 | 13.0 | 32 |
| 197 | Worcester West Midlands | 9.0% | 2,432 | 1,000 | 11.9 | 40 |
| 198 | Enfield London | 8.9% | 4,384 | 1,024 | 12.2 | 36 |
| 199 | Kensington and Chelsea London | 8.9% | 666 | 1,031 | 14.0 | 40 |
| 200 | Sefton North West | 8.8% | 5,707 | 987 | 13.9 | 49 |
| 201 | Bury North West | 8.8% | 3,368 | 893 | 12.9 | 37 |
| 202 | Conwy Wales | 8.8% | 3,108 | 942 | 14.6 | 38 |
| 203 | Monmouthshire Wales | 8.8% | 2,747 | 1,010 | 14.9 | 52 |
| 204 | Richmond upon Thames London | 8.8% | 3,637 | 1,024 | 13.1 | 42 |
| 205 | Kingston upon Thames London | 8.8% | 2,982 | 1,018 | 13.0 | 43 |
| 206 | Swale South East | 8.8% | 3,667 | 1,077 | 13.0 | 48 |
| 207 | Renfrewshire Scotland | 8.7% | 2,880 | 851 | 13.9 | 24 |
| 208 | Newcastle-under-Lyme West Midlands | 8.7% | 2,854 | 929 | 13.0 | 33 |
| 209 | Rushmoor South East | 8.7% | 1,939 | 1,022 | 13.0 | 43 |
| 210 | Exeter South West | 8.7% | 2,715 | 1,060 | 12.4 | 41 |
| 211 | Great Yarmouth East of England | 8.7% | 1,406 | 1,078 | 14.0 | 50 |
| 212 | Hackney London | 8.7% | 900 | 1,025 | 13.1 | 34 |
| 213 | Leeds Yorkshire and The Humber | 8.6% | 17,726 | 945 | 11.0 | 27 |
| 214 | Broxtowe East Midlands | 8.6% | 2,971 | 972 | 12.8 | 34 |
| 215 | East Lindsey East Midlands | 8.6% | 5,230 | 1,039 | 14.8 | 49 |
| 216 | Barnet London | 8.6% | 5,086 | 1,021 | 14.5 | 35 |
| 217 | Rotherham Yorkshire and The Humber | 8.5% | 5,223 | 955 | 13.3 | 34 |
| 218 | Trafford North West | 8.5% | 4,438 | 913 | 13.2 | 38 |
| 219 | North Hertfordshire East of England | 8.5% | 3,162 | 1,024 | 13.4 | 48 |
| 220 | Glasgow City Scotland | 8.4% | 4,510 | 850 | 13.1 | 22 |
| 221 | Rossendale North West | 8.4% | 1,281 | 860 | 12.9 | 37 |
| 222 | Wakefield Yorkshire and The Humber | 8.4% | 7,926 | 960 | 11.9 | 33 |
| 223 | Wirral North West | 8.4% | 8,348 | 974 | 11.6 | 29 |
| 224 | Coventry West Midlands | 8.4% | 7,943 | 986 | 10.9 | 28 |
| 225 | Portsmouth South East | 8.4% | 3,381 | 1,124 | 12.6 | 43 |
| 226 | Preston North West | 8.3% | 2,879 | 909 | 12.6 | 27 |
| 227 | East Riding of Yorkshire Yorkshire and The Humber | 8.3% | 10,529 | 997 | 13.2 | 39 |
| 228 | North Lincolnshire Yorkshire and The Humber | 8.3% | 4,468 | 985 | 14.1 | 33 |
| 229 | Carmarthenshire Wales | 8.3% | 5,846 | 972 | 15.2 | 33 |
| 230 | Thanet South East | 8.3% | 2,775 | 1,130 | 13.8 | 54 |
| 231 | Pembrokeshire Wales | 8.2% | 3,769 | 1,005 | 15.6 | 42 |
| 232 | Gosport South East | 8.2% | 1,645 | 1,116 | 12.6 | 48 |
| 233 | King's Lynn and West Norfolk East of England | 8.2% | 4,462 | 1,026 | 14.7 | 42 |
| 234 | Broxbourne East of England | 8.2% | 2,387 | 1,014 | 13.0 | 38 |
| 235 | Burnley North West | 8.1% | 1,278 | 859 | 12.7 | 18 |
| 236 | Hartlepool North East | 8.0% | 1,980 | 954 | 13.1 | 26 |
| 237 | Chesterfield East Midlands | 8.0% | 2,347 | 959 | 12.1 | 32 |
| 238 | Fenland East of England | 8.0% | 2,728 | 1,032 | 14.4 | 44 |
| 239 | Pendle North West | 7.9% | 1,564 | 853 | 12.8 | 17 |
| 240 | Birmingham West Midlands | 7.9% | 16,919 | 969 | 12.2 | 24 |
| 241 | Erewash East Midlands | 7.9% | 2,656 | 985 | 11.5 | 32 |
| 242 | North Northamptonshire East Midlands | 7.9% | 8,226 | 1,021 | 12.8 | 31 |
| 243 | Southend-on-Sea East of England | 7.9% | 2,797 | 1,079 | 15.2 | 47 |
| 244 | Dover South East | 7.9% | 2,594 | 1,121 | 13.6 | 52 |
| 245 | Lancaster North West | 7.8% | 2,843 | 944 | 12.6 | 23 |
| 246 | Rochdale North West | 7.8% | 3,375 | 866 | 12.4 | 27 |
| 247 | Bradford Yorkshire and The Humber | 7.8% | 9,282 | 924 | 12.2 | 25 |
| 248 | Sheffield Yorkshire and The Humber | 7.8% | 8,753 | 942 | 11.2 | 33 |
| 249 | Derby East Midlands | 7.8% | 4,822 | 980 | 12.2 | 25 |
| 250 | Dartford South East | 7.8% | 2,107 | 1,039 | 12.9 | 47 |
| 251 | Sunderland North East | 7.7% | 4,818 | 977 | 12.5 | 32 |
| 252 | Stockport North West | 7.7% | 5,437 | 898 | 13.2 | 36 |
| 253 | Cardiff Wales | 7.6% | 6,148 | 1,024 | 12.9 | 30 |
| 254 | North East Lincolnshire Yorkshire and The Humber | 7.6% | 4,248 | 1,028 | 12.4 | 31 |
| 255 | Harlow East of England | 7.6% | 1,177 | 1,032 | 12.1 | 40 |
| 256 | Calderdale Yorkshire and The Humber | 7.5% | 4,127 | 917 | 11.7 | 23 |
| 257 | Reading South East | 7.5% | 2,741 | 1,025 | 12.1 | 28 |
| 258 | Caerphilly Wales | 7.3% | 3,587 | 989 | 12.3 | 36 |
| 259 | Lambeth London | 7.3% | 1,800 | 1,017 | 13.7 | 26 |
| 260 | Powys Wales | 7.2% | 3,662 | 905 | 15.5 | 25 |
| 261 | Denbighshire Wales | 7.2% | 2,338 | 959 | 14.4 | 26 |
| 262 | Walsall West Midlands | 7.2% | 4,610 | 966 | 12.4 | 32 |
| 263 | Tamworth West Midlands | 7.2% | 1,446 | 973 | 12.4 | 38 |
| 264 | Gravesham South East | 7.2% | 1,742 | 1,054 | 13.7 | 40 |
| 265 | St. Helens North West | 7.1% | 2,877 | 937 | 13.1 | 29 |
| 266 | Hyndburn North West | 7.1% | 920 | 875 | 12.9 | 19 |
| 267 | Doncaster Yorkshire and The Humber | 7.1% | 5,578 | 980 | 13.9 | 24 |
| 268 | Ceredigion Wales | 7.1% | 2,003 | 958 | 15.8 | 19 |
| 269 | Peterborough East of England | 7.1% | 3,537 | 1,029 | 13.2 | 28 |
| 270 | Merthyr Tydfil Wales | 7.0% | 1,229 | 952 | 11.8 | 19 |
| 271 | Gloucester South West | 7.0% | 2,555 | 988 | 12.1 | 27 |
| 272 | Bristol South West | 7.0% | 7,419 | 1,022 | 11.9 | 27 |
| 273 | Greenwich London | 7.0% | 3,008 | 1,035 | 12.1 | 31 |
| 274 | Barnsley Yorkshire and The Humber | 6.9% | 4,717 | 950 | 11.3 | 20 |
| 275 | Blaenau Gwent Wales | 6.9% | 1,291 | 922 | 12.6 | 24 |
| 276 | Wandsworth London | 6.9% | 2,179 | 1,023 | 13.5 | 25 |
| 277 | Southwark London | 6.9% | 1,319 | 1,029 | 12.7 | 28 |
| 278 | Havering London | 6.9% | 4,538 | 1,045 | 13.3 | 47 |
| 279 | Bolsover East Midlands | 6.8% | 1,455 | 963 | 13.3 | 20 |
| 280 | Bridgend Wales | 6.8% | 2,991 | 1,062 | 13.4 | 37 |
| 281 | Halton North West | 6.7% | 2,313 | 933 | 12.0 | 23 |
| 282 | Stevenage East of England | 6.7% | 1,580 | 1,025 | 11.6 | 38 |
| 283 | Brent London | 6.7% | 2,997 | 1,024 | 13.4 | 22 |
| 284 | East Renfrewshire Scotland | 6.6% | 1,753 | 830 | 15.1 | 8 |
| 285 | Middlesbrough North East | 6.6% | 2,288 | 932 | 12.8 | 13 |
| 286 | Knowsley North West | 6.6% | 2,205 | 952 | 12.1 | 19 |
| 287 | Swansea Wales | 6.6% | 4,491 | 1,044 | 13.5 | 31 |
| 288 | Newport Wales | 6.6% | 3,017 | 1,029 | 11.9 | 46 |
| 289 | Hounslow London | 6.6% | 2,421 | 1,032 | 13.0 | 26 |
| 290 | Tameside North West | 6.5% | 3,040 | 859 | 12.1 | 21 |
| 291 | Boston East Midlands | 6.5% | 1,272 | 1,043 | 14.6 | 29 |
| 292 | Harrow London | 6.5% | 2,560 | 1,026 | 13.7 | 24 |
| 293 | Thurrock East of England | 6.5% | 2,620 | 1,057 | 12.3 | 38 |
| 294 | Gwynedd Wales | 6.4% | 2,623 | 942 | 14.5 | 23 |
| 295 | Gateshead North East | 6.3% | 3,082 | 949 | 11.8 | 30 |
| 296 | Croydon London | 6.2% | 4,274 | 1,015 | 13.5 | 23 |
| 297 | Darlington North East | 6.1% | 1,952 | 934 | 12.3 | 16 |
| 298 | Salford North West | 6.1% | 2,554 | 913 | 12.2 | 11 |
| 299 | Ipswich East of England | 6.1% | 2,090 | 1,079 | 11.8 | 31 |
| 300 | Redbridge London | 6.1% | 3,456 | 1,035 | 14.4 | 24 |
| 301 | Stoke-on-Trent West Midlands | 6.0% | 3,141 | 925 | 12.7 | 13 |
| 302 | Flintshire Wales | 5.9% | 2,991 | 961 | 12.5 | 28 |
| 303 | Wrexham Wales | 5.9% | 1,989 | 957 | 13.2 | 18 |
| 304 | Lincoln East Midlands | 5.9% | 1,122 | 1,010 | 13.4 | 17 |
| 305 | Oxford South East | 5.9% | 1,518 | 1,020 | 12.3 | 17 |
| 306 | Sandwell West Midlands | 5.7% | 3,615 | 963 | 11.9 | 15 |
| 307 | Epping Forest East of England | 5.7% | 1,878 | 1,023 | 14.3 | 33 |
| 308 | Merton London | 5.7% | 2,035 | 1,022 | 13.1 | 20 |
| 309 | Islington London | 5.7% | 474 | 1,026 | 11.8 | 20 |
| 310 | Manchester North West | 5.6% | 3,729 | 886 | 11.4 | 5 |
| 311 | Lewisham London | 5.5% | 1,703 | 1,026 | 12.4 | 23 |
| 312 | Neath Port Talbot Wales | 5.4% | 2,225 | 957 | 13.2 | 22 |
| 313 | Rhondda Cynon Taf Wales | 5.4% | 3,458 | 947 | 12.7 | 12 |
| 314 | Medway South East | 5.4% | 3,950 | 1,044 | 12.6 | 31 |
| 315 | Liverpool North West | 5.2% | 5,081 | 965 | 11.7 | 11 |
| 316 | Ealing London | 5.1% | 2,518 | 1,028 | 12.4 | 20 |
| 317 | Newham London | 5.0% | 1,917 | 1,028 | 11.4 | 19 |
| 318 | Torfaen Wales | 4.8% | 984 | 1,002 | 13.2 | 35 |
| 319 | Blackpool North West | 4.7% | 1,571 | 1,025 | 12.3 | 20 |
| 320 | Nottingham East Midlands | 4.7% | 2,884 | 978 | 11.3 | 10 |
| 321 | Luton East of England | 4.6% | 1,929 | 1,022 | 12.7 | 17 |
| 322 | Watford East of England | 4.6% | 959 | 1,014 | 12.2 | 18 |
| 323 | Slough South East | 4.5% | 956 | 1,024 | 11.5 | 18 |
| 324 | Kingston upon Hull Yorkshire and The Humber | 4.5% | 2,856 | 993 | 11.0 | 11 |
| 325 | Waltham Forest London | 3.8% | 1,797 | 1,021 | 12.2 | 15 |
| 326 | Hillingdon London | 3.7% | 2,184 | 1,034 | 13.1 | 23 |
| 327 | Tower Hamlets London | 3.0% | 187 | 1,023 | 10.7 | 15 |
| 328 | Barking and Dagenham London | 2.9% | 921 | 1,040 | 11.7 | 20 |
Britain's most solar-ready towns
Seaside and suburban towns built with detached and semi-detached homes lead the way. Bexhill-on-Sea tops the list.
| # | Town | Top-rated roofs | Top-rated homes | Homes graded | Sunshine (kWh per kW) |
|---|---|---|---|---|---|
| 1 | Bexhill-on-Sea Rother | 27.7% | 3,173 | 11,452 | 1,141 |
| 2 | Rustington Arun | 19.9% | 2,284 | 11,477 | 1,140 |
| 3 | Christchurch (Bournemouth, Christchurch and Poole) Bournemouth, Christchurch and Poole | 18.0% | 2,708 | 15,013 | 1,118 |
| 4 | Horndean East Hampshire | 18.0% | 2,023 | 11,250 | 1,111 |
| 5 | Chandler's Ford Eastleigh | 18.0% | 2,021 | 11,227 | 1,064 |
| 6 | Bognor Regis Arun | 17.6% | 3,457 | 19,679 | 1,141 |
| 7 | Whitstable Canterbury | 16.8% | 1,856 | 11,073 | 1,092 |
| 8 | Nuneaton Nuneaton and Bedworth | 16.7% | 4,203 | 25,234 | 984 |
| 9 | Chippenham (Wiltshire) Wiltshire | 16.3% | 1,649 | 10,113 | 1,009 |
| 10 | Burgess Hill Mid Sussex | 16.1% | 1,726 | 10,747 | 1,113 |
| 11 | Kingswinford Dudley | 16.0% | 2,502 | 15,619 | 953 |
| 12 | Clacton-on-Sea Tendring | 15.8% | 2,589 | 16,349 | 1,110 |
| 13 | Worthing Worthing | 15.7% | 4,256 | 27,168 | 1,143 |
| 14 | Weymouth Dorset | 15.1% | 2,288 | 15,103 | 1,145 |
| 15 | Totton New Forest | 15.0% | 1,506 | 10,017 | 1,073 |
| 16 | Weston-super-Mare North Somerset | 14.8% | 3,254 | 22,012 | 1,050 |
| 17 | Haywards Heath Mid Sussex | 14.7% | 1,695 | 11,501 | 1,088 |
| 18 | Macclesfield Cheshire East | 14.6% | 1,896 | 12,999 | 883 |
| 19 | Rugby Rugby | 14.5% | 2,975 | 20,489 | 1,000 |
| 20 | Woking Woking | 14.5% | 2,649 | 18,310 | 1,024 |
Head to head
Pick any two council areas and see whose roofs come out on top.
Region by region
Share of homes with a top-rated roof in each region, with the yearly sunshine yield from each kW of panels.
Record breakers
How we made this
LiDAR is a laser survey flown from planes. It measures the height of everything on the ground, which shows the exact shape of every roof: its ridges, slopes and which way each slope faces.
We matched that survey to 17,830,853 buildings and their addresses, measured each roof, worked out how many standard 400 W panels would fit on its best side, and graded every house A+ to C. Sunshine figures come from the European Commission's PVGIS solar model.
Left out of every figure: flats, shops and offices, listed buildings, buildings with several homes inside, roofs too small for six panels and homes that already have solar.

Common questions
Where is the best place in the UK for solar panels?+
What percentage of UK homes are suitable for solar panels?+
How many UK homes already have solar panels?+
Is my house suitable for solar panels?+
Where should solar installers market?+
Can I use this data?+
Every council area, A to Z
Show all 328 council areas
Use and cite this data
Everything on this page is free to use, quote and republish under a Creative Commons Attribution 4.0 licence. Please credit Solar Mailshot and link to this page.
How the numbers are made, step by step: method and grading explained. Download the full tables: council areas (CSV) and towns (CSV). Last updated 10 November 2026.
Turn the data into letters.
Solar Mailshot finds the top-rated roofs in your area and posts each homeowner a personalised letter showing their own roof, in your branding.