
Solar panels in West Lothian: how good are the roofs?
We graded every house in West Lothian (Scotland) for solar from a laser survey of its roofs. Here is how it compares with the rest of Britain: the best roofs, sunshine, house types and what it means for anyone thinking about solar.
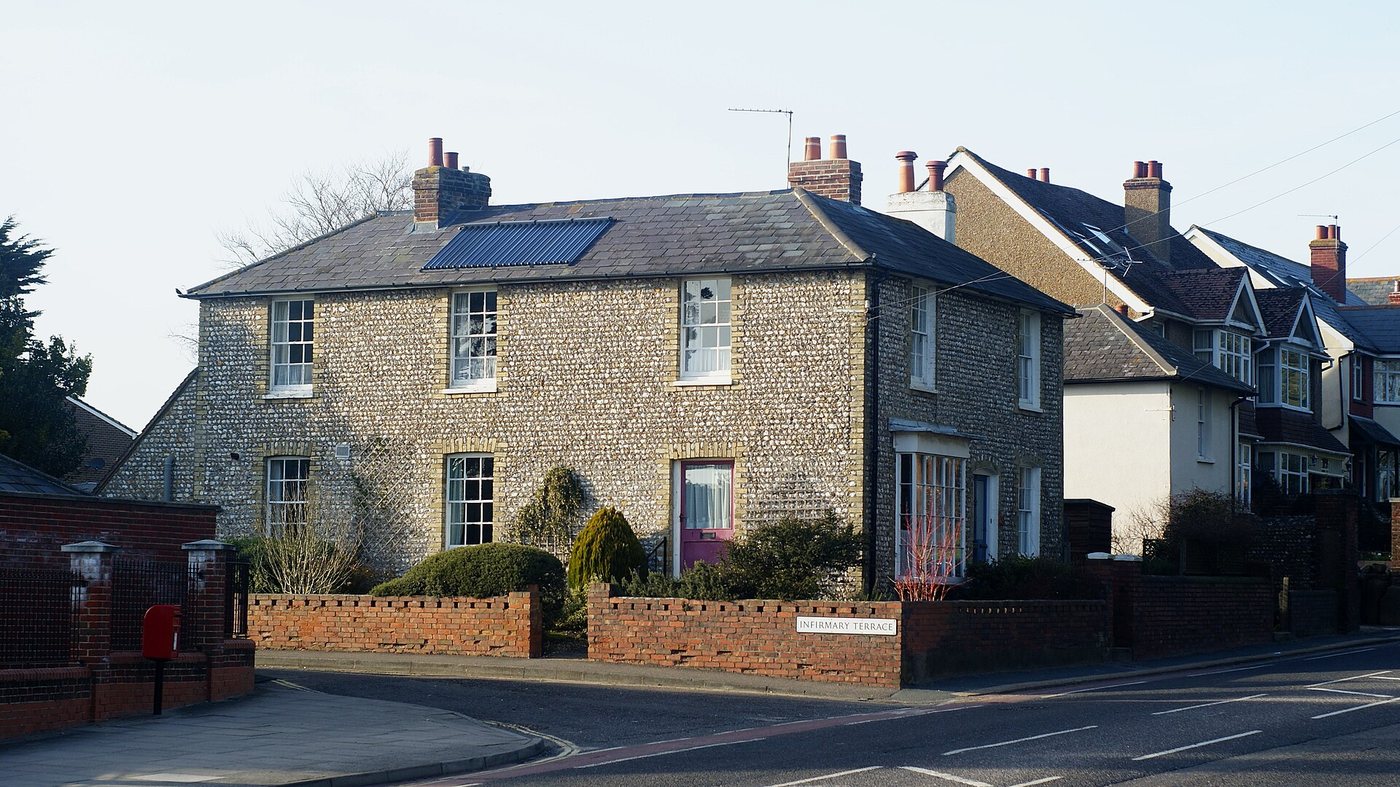

West Lothian's roofs beat its low sunshine
West Lothian gets less sun than almost anywhere in Britain: 827 kWh per kW, 326th of 328 areas, against 999 nationally. Yet its roofs still rate well. 15.2% of graded homes are rated A or A+, 22nd in Britain and 1.5 times the national rate.
Direction does a lot of the work. 73.8% of homes have their best roof face pointing south, south-east or south-west, against 64.1% nationally. Roofs are close to average in size, fitting 13.7 panels, and 39.2% of homes are detached, a little above the 34.6% British figure.
North Lanarkshire next door has a similar mix, with 74.7% of roofs facing the right way and slightly bigger roofs, but it reaches 12.3%. City of Edinburgh does better, at 18.0%, helped by more bungalows (18.8% against 13.1% here).
If you're thinking about solar in West Lothian, don't let the low sunshine figure put you off. A roof facing south, south-east or south-west is the best sign that yours rates well, and most homes here have one.
If you install or market solar here, 6,960 homes have a top-rated roof, most of them helped by good roof direction rather than sun. West Lothian scores 62 out of 100 for solar marketing, 105th in Britain.
How West Lothian roofs grade
- West Lothian is above the national average for top-rated roofs (15.2% against 10.3%).
- Each kW of south-facing panels here produces about 827 kWh a year (PVGIS), 172 kWh less than the British average of 999 kWh.
West Lothian compared with Scotland and Great Britain
| Measure | West Lothian | Scotland | Great Britain |
|---|---|---|---|
| Homes with an A or A+ roof | 15.2% | 12.8% | 10.3% |
| Homes with an A+ roof (due south) | 1.5% | 1.2% | |
| Yearly yield per kW of panels (PVGIS) | 827 kWh | 876 kWh | 999 kWh |
| Average panels per graded roof | 13.7 | 13.5 | |
| Best roof face pointing SE, S or SW | 73.8% | 64.1% | |
| Detached or semi-detached (homes with an EPC) | 64.4% | 68.5% | |
| Bungalows (homes with an EPC) | 13.1% | 12.7% |
Nearby areas
Marketing solar in West Lothian
For an installer, the useful number is not how many homes there are, but how many have a roof worth writing to. In West Lothian that is 6,960 A and A+ homes, plus 30,129 B-grade homes that are often still good candidates.
Solar Mailshot grades every one of these roofs and posts a personalised letter showing each homeowner their own roof with panels drawn on, in the installer's branding. Homes that already have panels, flats and roofs too small for six panels are left out before anyone pays. See how targeted mailshots work, or Tell the Neighbours for writing to the best roofs around a finished install.
Common questions
How many homes in West Lothian are suitable for solar panels?+
Is West Lothian sunny enough for solar?+
Where do these figures come from?+
Use and cite this data
Everything on this page is free to use, quote and republish under a Creative Commons Attribution 4.0 licence. Please credit Solar Mailshot and link to this page.
How the numbers are made, step by step: method and grading explained. Download the full tables: council areas (CSV) and towns (CSV). Last updated 10 November 2026.
Write to the best roofs in West Lothian.
Pick a postcode, see every graded home and post personalised letters in your own branding.