
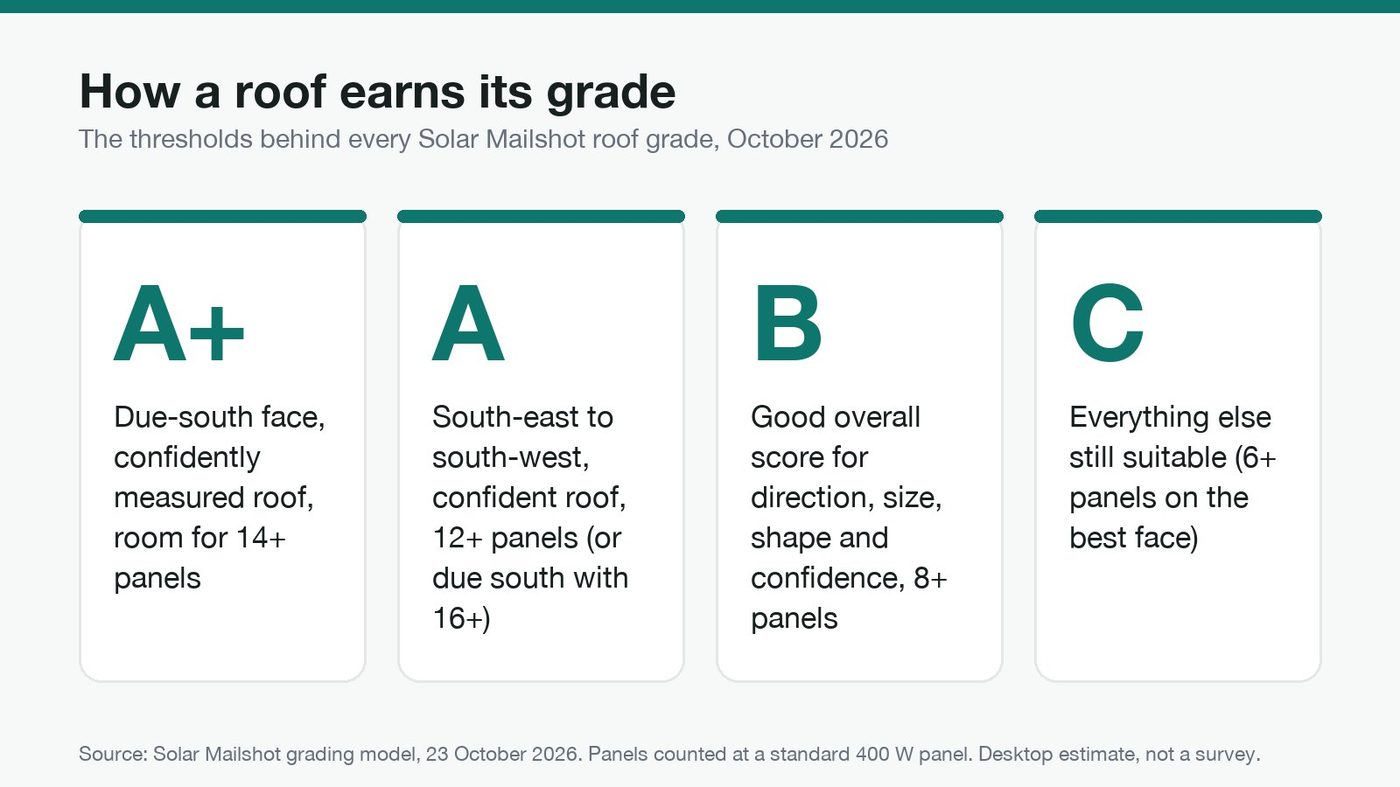
The short answer: LiDAR roof analysis for solar turns open government laser surveys into a measured roof for every home: which way each face points, how big it is and how many panels fit. We match each roof to a postable address, remove homes that will never become a job, then grade the rest. An A+ roof has a due-south face, a confidently measured shape and room for 14 or more panels.
Our overview of how we graded 15 million UK roofs explains the idea. This is the deep dive installers keep asking for: every step, the evidence behind it and the exact thresholds. Disclosure: I'm Callum Jones and I run Solar Mailshot. This post describes our own method.
What does LiDAR actually measure?
LiDAR (light detection and ranging) is a laser fired from a survey plane. Each pulse bounces off whatever it hits, and the time it takes to come back gives a height. Millions of these returns make a point cloud: a 3D record of the ground, trees and every roof.
In England, the Environment Agency's National LIDAR Programme captured the whole country at 1 metre resolution, flying in the winter months between January 2017 and February 2023. The raw point clouds are published as .laz files under the Open Government Licence. Wales has its own public LiDAR on DataMapWales, and Scotland's public sector LiDAR is on the Scottish Remote Sensing Portal, also under the Open Government Licence.
We use the raw point clouds, not a smoothed height map, and process them tile by tile across mainland Britain: 14,960,000 roofs in total, with 97.5% fitted to LiDAR.
How do laser points become a roof shape?
This is the core of LiDAR roof analysis for solar, and it happens in four steps for every building.
- Cut out the building. Each building's outline is used to keep only the points that fell on that roof, so a neighbour's tree or extension doesn't leak in.
- Find the faces. Open-source roof analysis from WhiteboxTools splits the points into flat roof planes and records the slope and direction of each one.
- Fit a real roof. Raw planes are noisy: chimneys, dormers and overhanging trees break them up. So we fit the faces to real roof templates, such as a centred gable or a hipped roof, with a least-squares fit (the shape that best matches the measured points). Energy certificate details, like whether it is a house or a bungalow and its built form, plus matching neighbours, are used as clues, never as proof.
- Score the evidence. Where the fit is weak, the roof is flagged. That flag is the roof confidence, and it lowers the grade.
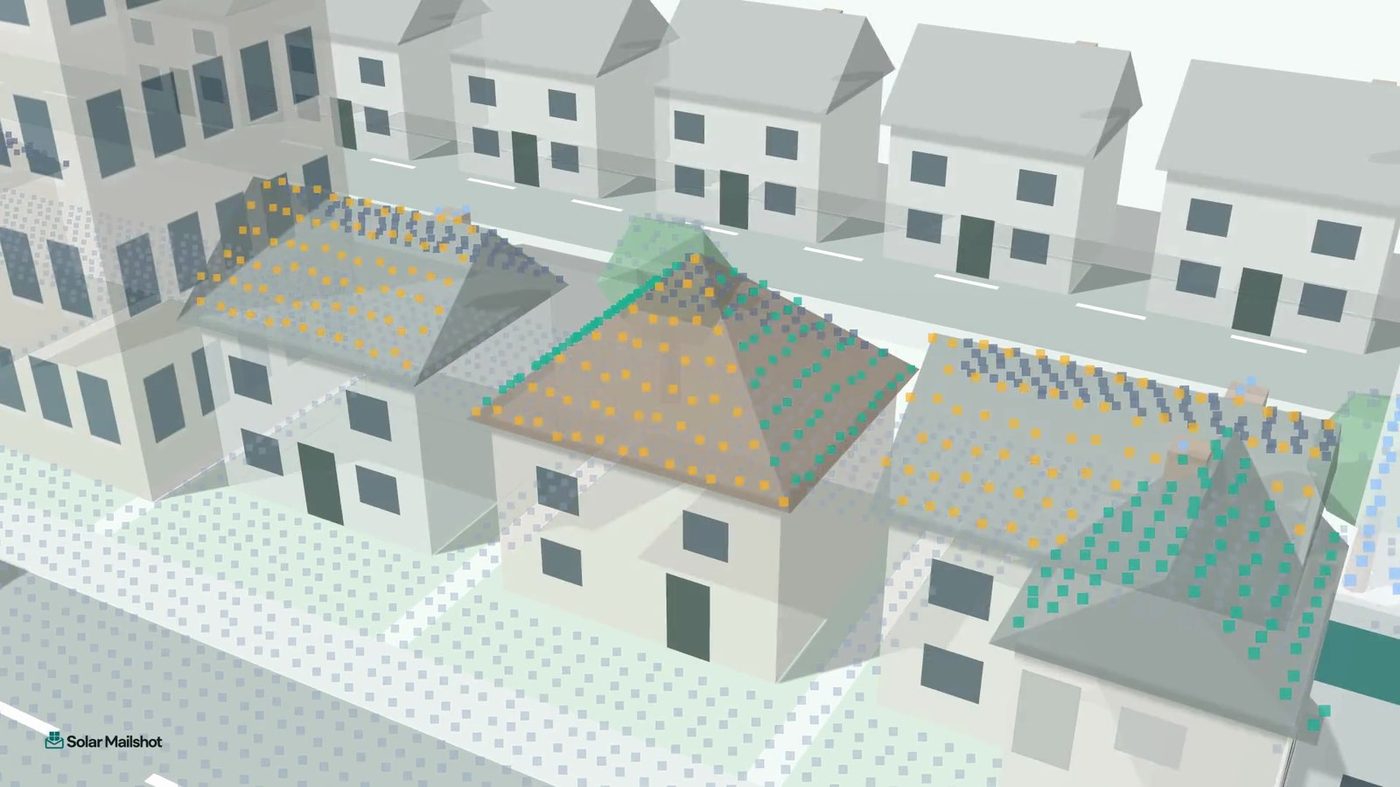
About 380,000 homes, mostly on the Scottish islands and in the Highlands, have no laser scan yet. For those, roof direction is estimated from the building outline only, and they can never be graded above B.
How is a roof matched to an address you can post to?
A roof only becomes a lead when it has a letterbox. Every UK address has a UPRN (Unique Property Reference Number), a permanent ID allocated by councils and coordinated nationally by GeoPlace. We match each roof to a UPRN.
The catch is that building outlines and address points can sit a few metres apart. So in England and Wales each match is checked against the HM Land Registry INSPIRE land parcel, the open map of registered freehold land. If the roof and address don't sit on the same parcel and we aren't sure, the address is left unmatched. A missing home is better than a letter about the wrong roof.
Which homes are removed before grading?
Before any roof is graded, we take out homes that won't become a job for you. Each one needs evidence:
| Removed | Evidence used | Why |
|---|---|---|
| Flats and maisonettes | Energy certificates, OpenStreetMap "apartments" | Shared roof, no single owner to say yes |
| Known council property | Energy certificate tenure "rented (social)" | The occupant can't commission the work |
| Shops, offices, commercial | Building class data, OpenStreetMap shop and office tags | Not a home |
| Garages, sheds, caravans | Building class data | Not a home |
| Listed and heritage buildings | Official listed-building flags, OpenStreetMap heritage tags | Planning makes solar unlikely |
| Homes that already have solar | Energy certificates (about 130,000 homes), OpenStreetMap mapped rooftop installs | Already sold |
| Several addresses under one roof, or not yet built | Address and building data | No single household to write to |
| Roofs too small | Our own measurement | Fewer than 6 panels on the best face |
The existing-solar check is worth a note. Energy certificates record panels on about 130,000 homes. OpenStreetMap volunteers have mapped about 588,000 rooftop installs in Great Britain, which we match to about 279,000 homes, most of them not on any certificate. Using both catches far more than either alone. For a plain-English version of these checks, see how to find homes suitable for solar.
How does LiDAR roof analysis for solar become a grade?
Now the grading itself. There are three measurements and one judgement.
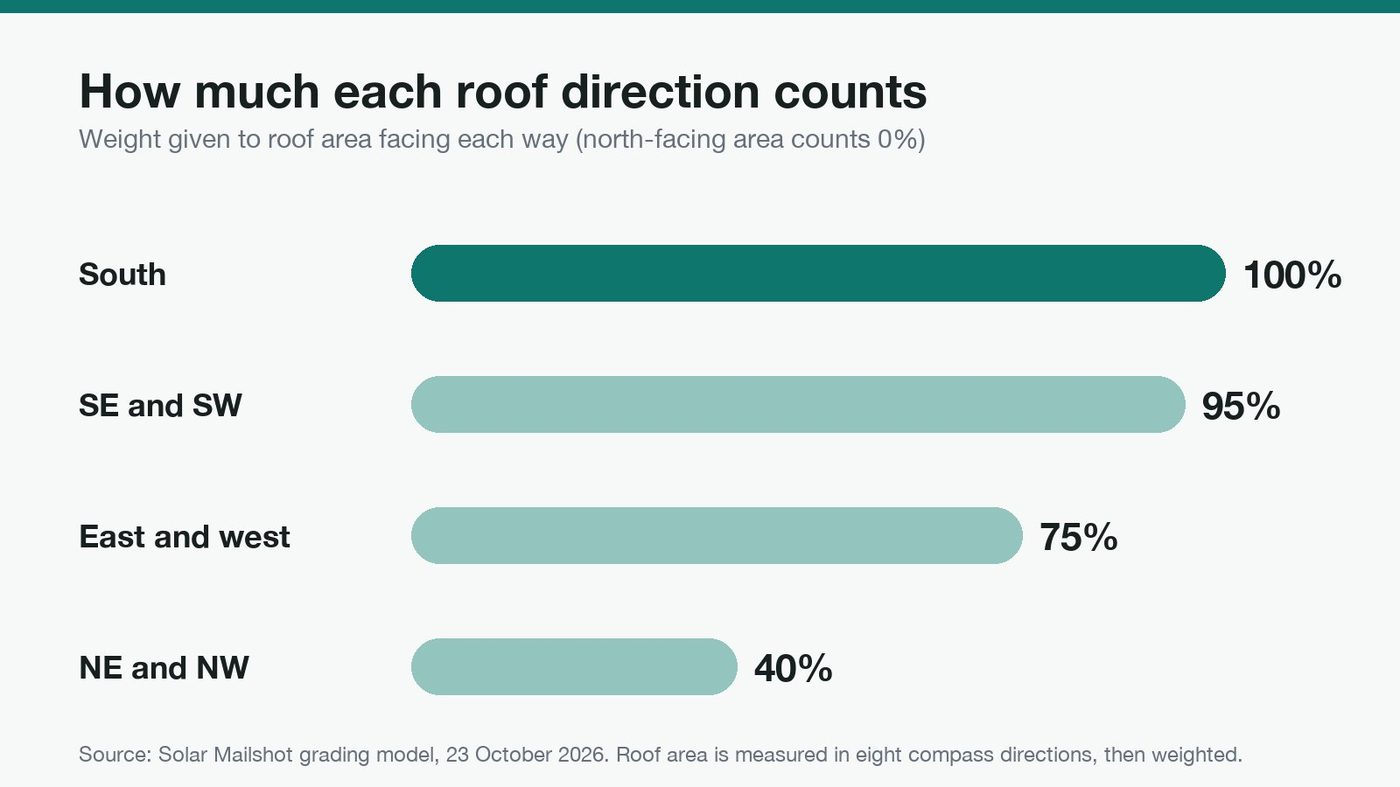
Direction. Roof area is measured in eight compass directions, and each is weighted for solar:
Usable area. We take 75% of the best face, leaving room for edges, vents and spacing.
Panel count. Panels are counted at a standard 400 W panel (1.134 m by 1.722 m, about 1.95 m² each). Letters show up to 20 panels.
Confidence. How strong the roof fit was (see above).
Those combine into four grades:
| Grade | What it takes |
|---|---|
| A+ | A due-south face, a confidently measured roof, and room for 14 or more panels |
| A | A south-east to south-west face on a confident roof with 12 or more panels, or a due-south face big enough for 16 or more panels even if the measurement is less certain |
| B | A good overall score (direction, size, shape and confidence) and room for 8 or more panels |
| C | Everything else that is still suitable |
A+ and A together are roughly the top 1 in 6 homes.
Three caps stop a roof being over-graded. A home recently recorded as privately rented is capped at B, because the person reading the letter may not own it. A home with no laser scan is capped at B. And a building with no evidence either way about what it is (no building class, no certificate, no map tag) is capped at C rather than trusted.
What do the grades look like on real roofs?
Some worked examples, using simple arithmetic (illustrative, not a forecast, and rounded down to whole panels):
| Example roof | Usable area (75%) | Panels | Grade |
|---|---|---|---|
| Due-south face of 40 m², confident fit | 30 m² | 15 | A+ |
| South-west face of 34 m², confident fit | 25.5 m² | 13 | A (not due south, so not A+) |
| Due-south face of 45 m², trees overhang so weak fit | 33.75 m² | 17 | A (16+ route), never A+ while confidence is low |
| Best face east, 25 m², good overall score | 18.75 m² | 9 | B |
| Due-south face of 45 m², Highland home with no laser scan | 33.75 m² | 17 | B at most (no-scan cap) |
What happens after an installer pays?
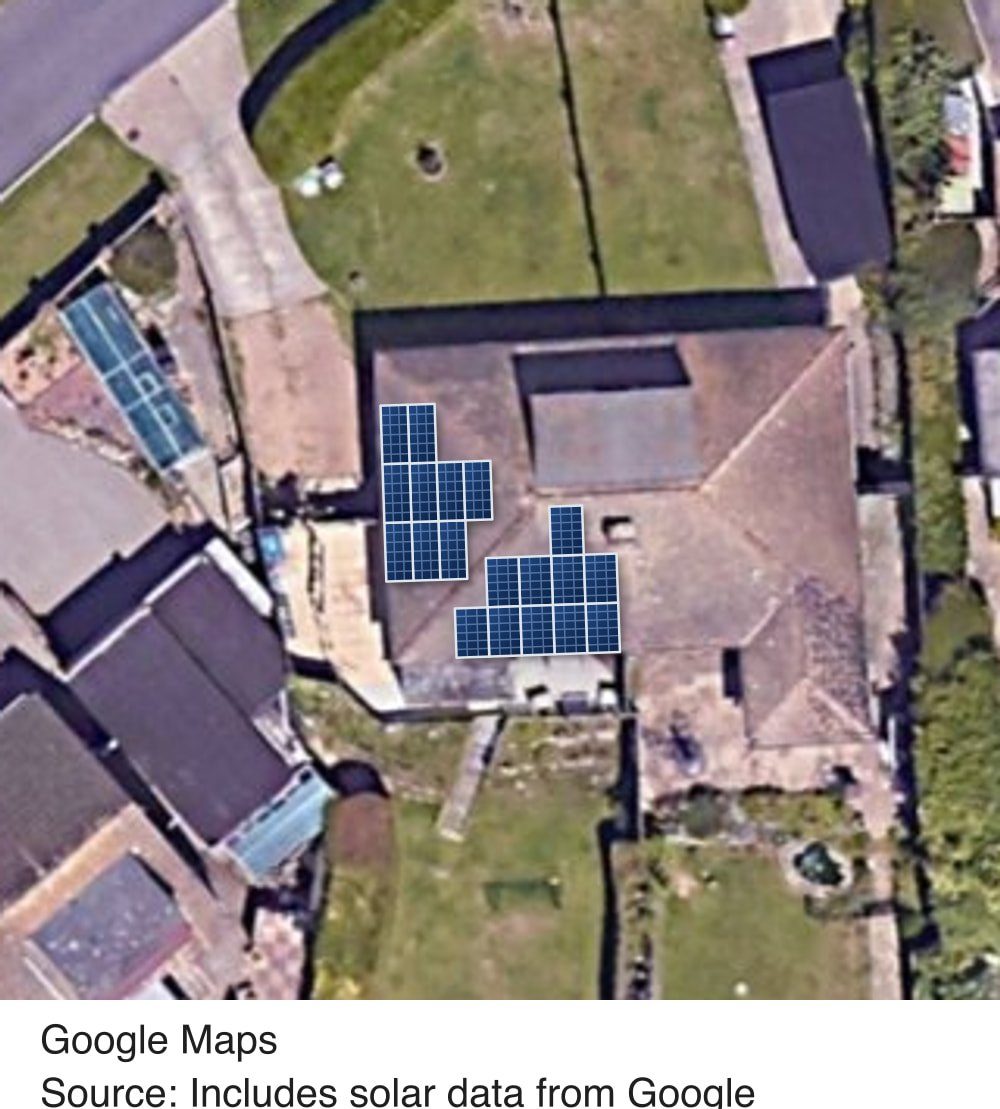
Grading happens before you spend anything. After payment, every home gets a second look: a visual check for existing panels using Google solar data, and every address confirmed. Any home that fails is removed and its credit goes back to the installer.
The generation figure on each letter comes from Google solar data, scaled to the panel count. Savings use a published electricity price benchmark: the Ofgem price cap unit rate of 26.11p per kWh for July to September 2026. It is a desktop estimate, not a survey, and the letter says so.
What can't a desktop estimate tell you?
Honesty matters here. LiDAR can't see shading from next door's new extension built after the survey, the condition of the roof, the inside of the loft, or whether the owner actually wants solar. That's what your survey is for. The grade tells you which doors are worth knocking on, not what you'll find behind them.
How Solar Mailshot solves this
Without roof data, picking homes to market to is guesswork. Here's the contrast:
| Problem | The usual way | With Solar Mailshot |
|---|---|---|
| Which homes suit solar? | Eyeball the street or satellite photos one by one | Every roof measured from raw LiDAR point clouds and graded A+ to C |
| How sure is the measurement? | No way to tell | A confidence score that lowers the grade when evidence is weak |
| Wasted letters to flats, known council property, listed buildings and homes with panels | Everyone on the postcode gets the same flyer | Removed before you pay, with a second check after payment and credit back for failures |
| Wrong address for the roof | Rarely checked | Matches checked against the Land Registry parcel, left unmatched if unsure |
| A message that says nothing about the house | "Solar could save you money" | A letter showing their own roof, panel count and estimated generation |
From there, Targeted Mailshot lets you pick graded homes across your patch, and each home you mail is reserved for you for 6 months. Tell the Neighbours is the best first campaign: the best 30 roofs on your install's road for £75 (provisional pricing). We print and post every letter, pay as you go, no subscription.
Solar Mailshot is opening soon. Get early access by joining the waitlist, or watch how we grade roofs in two minutes. More on the Solar Mailshot homepage.
Is this the final version of the model?
No. We're constantly tweaking and improving the model, but today, this is how it stands.
Sources
- data.gov.uk: National LIDAR Programme (1 m resolution for all of England, captured January 2017 to February 2023, point clouds in .laz, Open Government Licence)
- DataMapWales: LiDAR viewer and downloads
- Scottish Remote Sensing Portal: about (Scottish public sector LiDAR, Open Government Licence)
- WhiteboxTools source: LidarRooftopAnalysis (roof segments with slope and aspect from a LiDAR point cloud)
- Energy Performance of Buildings Data (domestic energy certificates for England and Wales, Open Government Licence)
- GeoPlace: how an address is created (UPRNs)
- GOV.UK: INSPIRE Index Polygons spatial data (HM Land Registry freehold parcels, England and Wales, updated monthly)
- OpenStreetMap (building, shop, office, heritage and rooftop solar tags)
- Ofgem: energy price cap levels (electricity unit rate 26.11p per kWh, 1 July to 30 September 2026)
- Solar Mailshot pipeline and grading model, figures as of 23 October 2026