
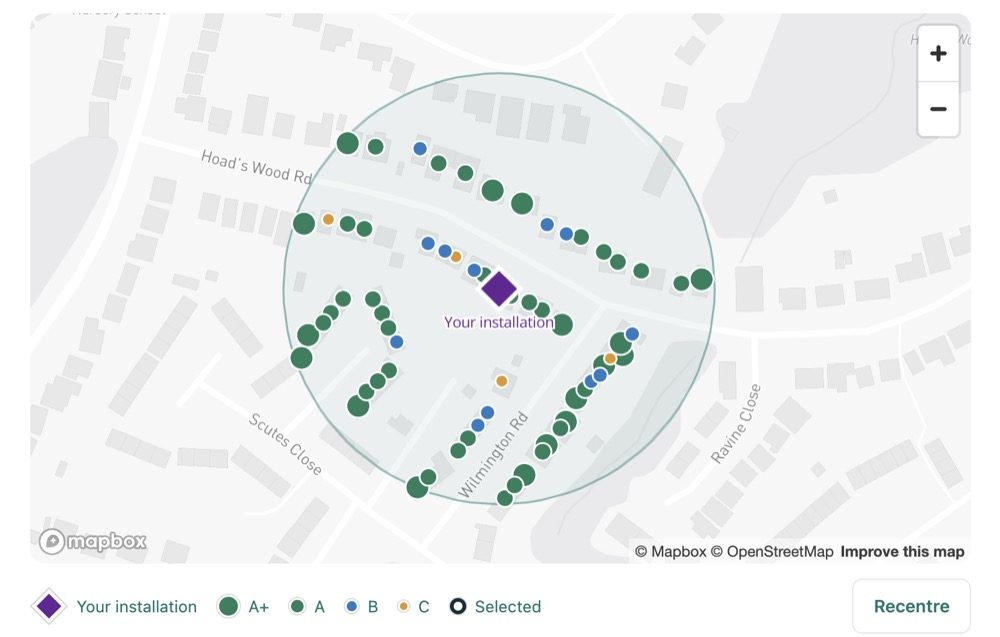
The short answer: to find homes suitable for solar, check four things about each roof: which way it faces, how much usable area it has, its pitch, and how much shade falls on it. Then take out the homes that can never become a job, starting with the ones that already have panels. Only the roofs left are worth a letter or a knock.
Every installer knows a bad roof is a wasted visit. The harder question is how to find homes suitable for solar before you spend money on letters, fuel or a morning on the doorstep. This guide covers what makes a roof worth mailing, why the usual ways of checking don't scale, and how roof data does the sorting for you.
Why does picking the right roofs matter more now?
Because more of the roofs on any street are already done. DESNZ figures reported by Solar Power Portal show 291,000 new solar PV installations in the 12 months to August 2026, the most in any 12 month period since 2012. More than 195,000 of those were homes, and the UK now has 2,131,000 solar installations in total.
Simple arithmetic, not a forecast: 195,000 homes a year is about 3,750 homes a week having panels fitted. Every one of those is a door where a solar letter is now wasted. A street that looked full of prospects two years ago may have half a dozen arrays on it today.
That is good news for the industry and a warning for your marketing. Mailing every door on a postcode was always a blunt tool. With more roofs already taken, it gets blunter every month.
How do you find homes suitable for solar?
Work through the same four questions for every roof, in this order.
- Which way does it face? South is best, but it is not the only good answer (see the table below).
- How much usable area is there? Enough clear roof for a system worth fitting, once you allow for chimneys, dormers, roof lights and vent pipes.
- What is the pitch? Around 30 to 40 degrees is ideal in the UK. Flatter or steeper roofs still work, with some loss.
- How much shade falls on it? Trees, taller neighbours and chimneys can cost more output than a poor direction.
Then remove the homes that pass on paper but will never buy from you: homes that already have panels, flats with a shared roof, listed buildings and commercial property.
What makes a roof suitable for solar?
Direction
South-facing roofs generate the most, but east and west roofs are far from a write-off. Evo Energy's figures, which cite the Energy Saving Trust, put it like this:
| Roof direction | Output compared with due south |
|---|---|
| South | 100% |
| South-east or south-west | About 90 to 95% |
| East or west | About 80 to 85% |
| North-east or north-west | About 65 to 75% |
| North | About 55 to 65% |
The practical point: don't skip east and west roofs. A good east or west roof with plenty of space is often a better prospect than a small, shaded south-facing one. Many households also like east-west systems because they generate across the morning and evening, when people are at home.
Pitch
The Green Age puts the ideal angle at about 30 degrees, a trade-off between the low sun at either end of the day and the high midday sun. Most pitched UK roofs sit close enough to that range for pitch to be a smaller factor than direction or shade.
Shade
Shade is the one that catches people out. As The Green Age explains, a panel in shade produces far less, and on a simple string system one shaded panel can drag down the rest. A south roof under a big oak can be a worse prospect than an unshaded east roof next door.
Usable area
Direction and pitch tell you how well each panel will do. Usable area tells you how many panels fit, and so whether the job is worth quoting. A hipped roof broken up by a dormer and two roof lights can look fine from the street and leave room for very little.
Why don't driving round and Google Maps scale?
Most installers start the same way: drive the patch, or flick through satellite views, and make a note of roofs that look good. It works for twenty houses. It doesn't work for two thousand.
- You can't see pitch or usable area from the street. You can guess direction from the road, but not how much clear roof there is behind the ridge.
- Satellite photos flatten roofs. You can see which way a roof faces, but not its angle, and shade from trees changes through the year.
- Existing panels are easy to miss. Panels on a rear roof slope are invisible from the road, and satellite imagery can be years old. With 3,750 homes a week getting panels (on the arithmetic above), old imagery goes stale fast.
- It doesn't tell you what the building is. Flats, listed buildings and council property look like any other roof from above.
- It eats your time. An afternoon checking roofs is an afternoon not quoting or installing.
None of that makes the roof any less important. It just means checking by eye is the wrong tool for a whole town.
How does LiDAR roof data grade roofs?
LiDAR is a laser survey flown from a plane. Each pulse measures height, and millions of them build a 3D picture of every roof. In England, the Environment Agency's National LIDAR Programme publishes this data openly at 1 metre resolution, and similar public surveys cover Wales and Scotland.
From those points you can work out the four things that matter: the direction each roof face points, its pitch, how much of it is usable, and where taller objects such as trees block it. That is the same checklist as above, done for every roof at once rather than one street at a time.
We explain exactly how we did this in LiDAR roof data: how we graded 15 million UK roofs, including how each roof is fitted to a real roof shape and matched to an address.
How Solar Mailshot solves this
Disclosure: Callum Jones, who writes this blog, runs Solar Mailshot.
Solar Mailshot exists because finding homes suitable for solar should happen before you spend, not after. Here is each problem from this post, and how we handle it:
| Problem | The usual way | With Solar Mailshot |
|---|---|---|
| Knowing which roofs suit solar | Drive round or check satellite photos one house at a time | Nearly 15 million roofs across mainland Britain graded A+, A, B or C from LiDAR roof data |
| East and west roofs | Skipped, or treated the same as south | Direction counts in the grade, so good east and west roofs still show up |
| Pitch, area and shade | Guessed from the street | Measured from the roof data and built into the grade |
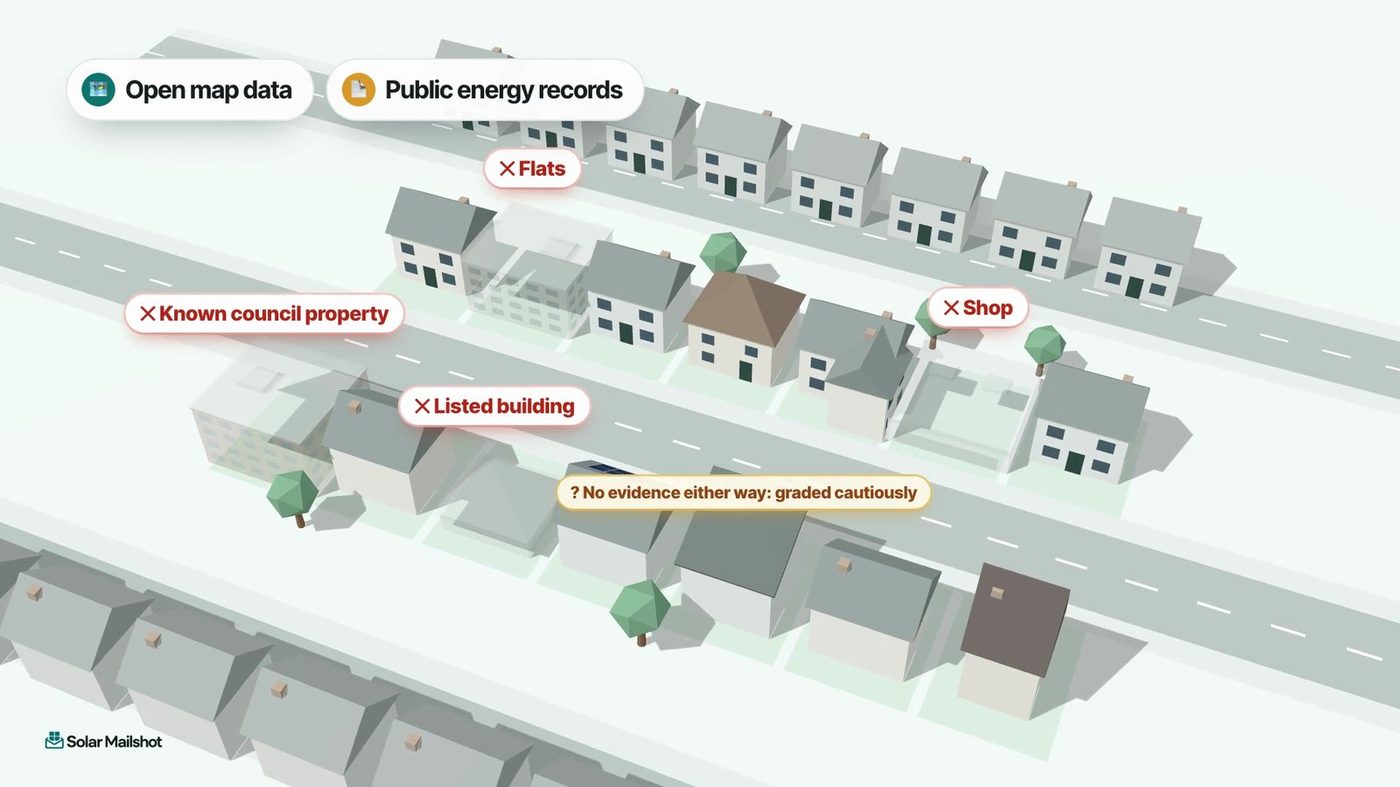
| Homes that already have panels | Missed on rear slopes or old imagery | Removed before you pay, then a second visual check after payment; if panels are spotted, the home is removed and the credit comes back to you |
| Homes that will never buy | Flats, listed buildings and shops get the same letter | Flats, known council property, listed buildings and commercial property removed before you pay |
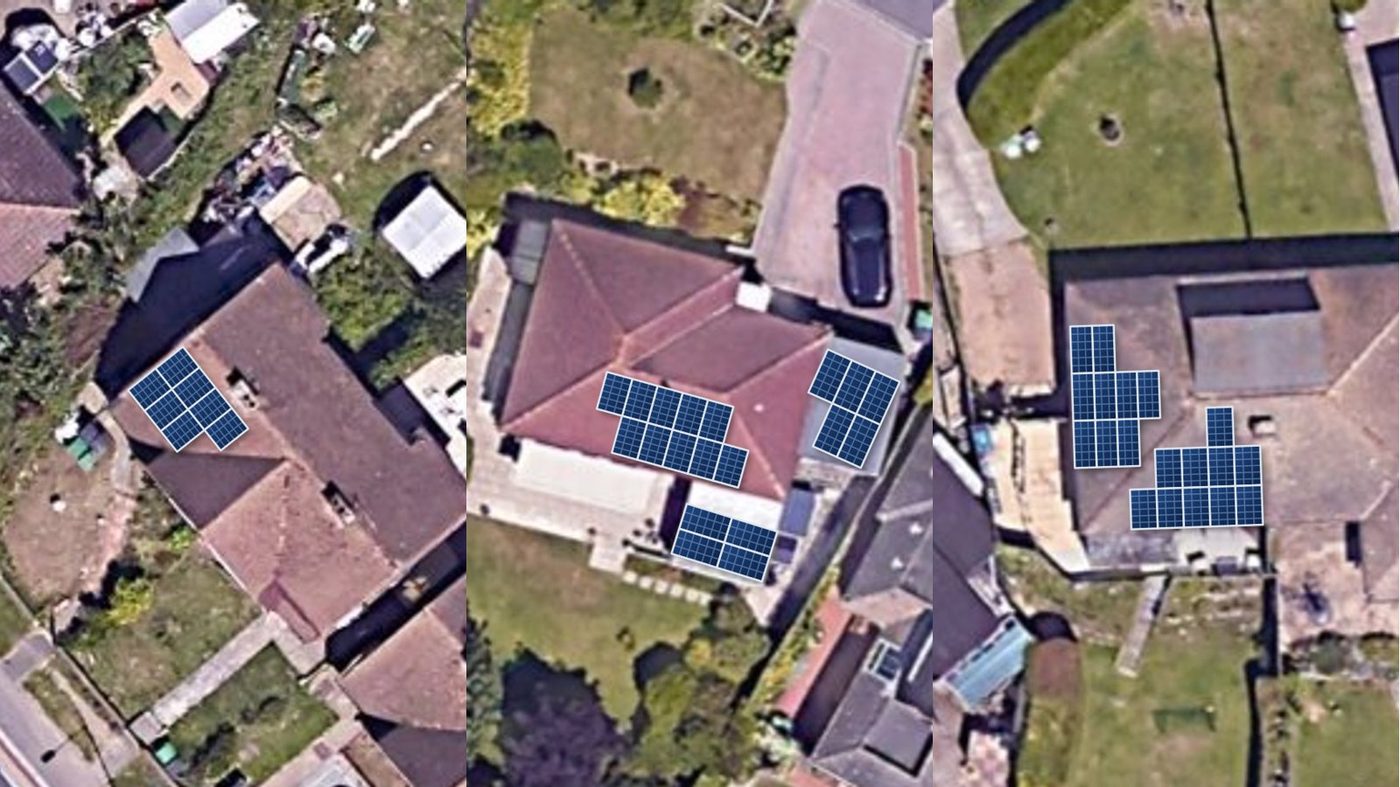
| Saying something about the house | "Solar could save you money" | A personalised letter showing the home's own roof with panels drawn on, and its own estimated figures |
| Getting the letters out | Print, fold and post them yourself | We print and post every letter under your name |
The grade is a desktop estimate, not a survey, and the letter says so. Final suitability is still confirmed at your own visit.
Two ways to use it:
- Tell the Neighbours is the best first campaign: the best 30 roofs on your install's road for £75 (30 letters at the £2.50 standard rate, provisional pricing). Your finished install is the proof, and the letter goes to the graded homes that can see it.
- Targeted Mailshot is for scaling. Ready to scale? Own your territory. Once we open, you choose a postcode or an area and the grades you want, and each home you mail is reserved for you for 6 months and removed from other installers' searches.
Pricing is pay as you go: credits from £1.30 to £2.50 each, 1 credit = 1 printed and posted letter, no subscription, no contract (provisional). It costs more per piece than a leaflet, so the point is to spend it only on roofs that are worth it.
What should you do next?
- Stop mailing whole postcodes. Every letter to a home with panels, or a north roof under a tree, is money spent on nobody.
- Count east and west roofs in. At about 80 to 85% of south's output, they are real prospects.
- Check the street around every install first. It is where you have proof on show. Read why the street around your last install is your best audience.
- Let the data do the sorting. Spend your time on surveys and quotes, not on Google Maps.
Solar Mailshot is opening soon. Join the waitlist and get early access to see the graded homes on your own patch when we launch. You can also see more on the homepage.
Sources
- Solar Power Portal: UK installs record 291,000 new solar PV installations in 12-month period (DESNZ data, October 2026)
- Evo Energy: Best directions for solar panels (output by orientation, citing the Energy Saving Trust)
- The Green Age: Impact of orientation, pitch and shading on solar PV
- data.gov.uk: Environment Agency National LIDAR Programme (England, 1m resolution, open data)